# How to debug custom plugins
This chapter describes how to debug custom plug-ins, which can help developers quickly locate problems.
# premise
Before learning how to debug custom plugins, you need to know:
- Custom components are developed based on javascript system
# debugging tools
It is recommended to use the chrome browser and the devtools tools provided by the browser for debugging (other non-webkit core browsers also have tools with the same functions, but the usage is slightly different). For specific usage, click here (opens new window)to learn.
# Debug JS
Open the console can be used, macOS: cmd + option + i or right click "check"; Window: F12 or right click "check".
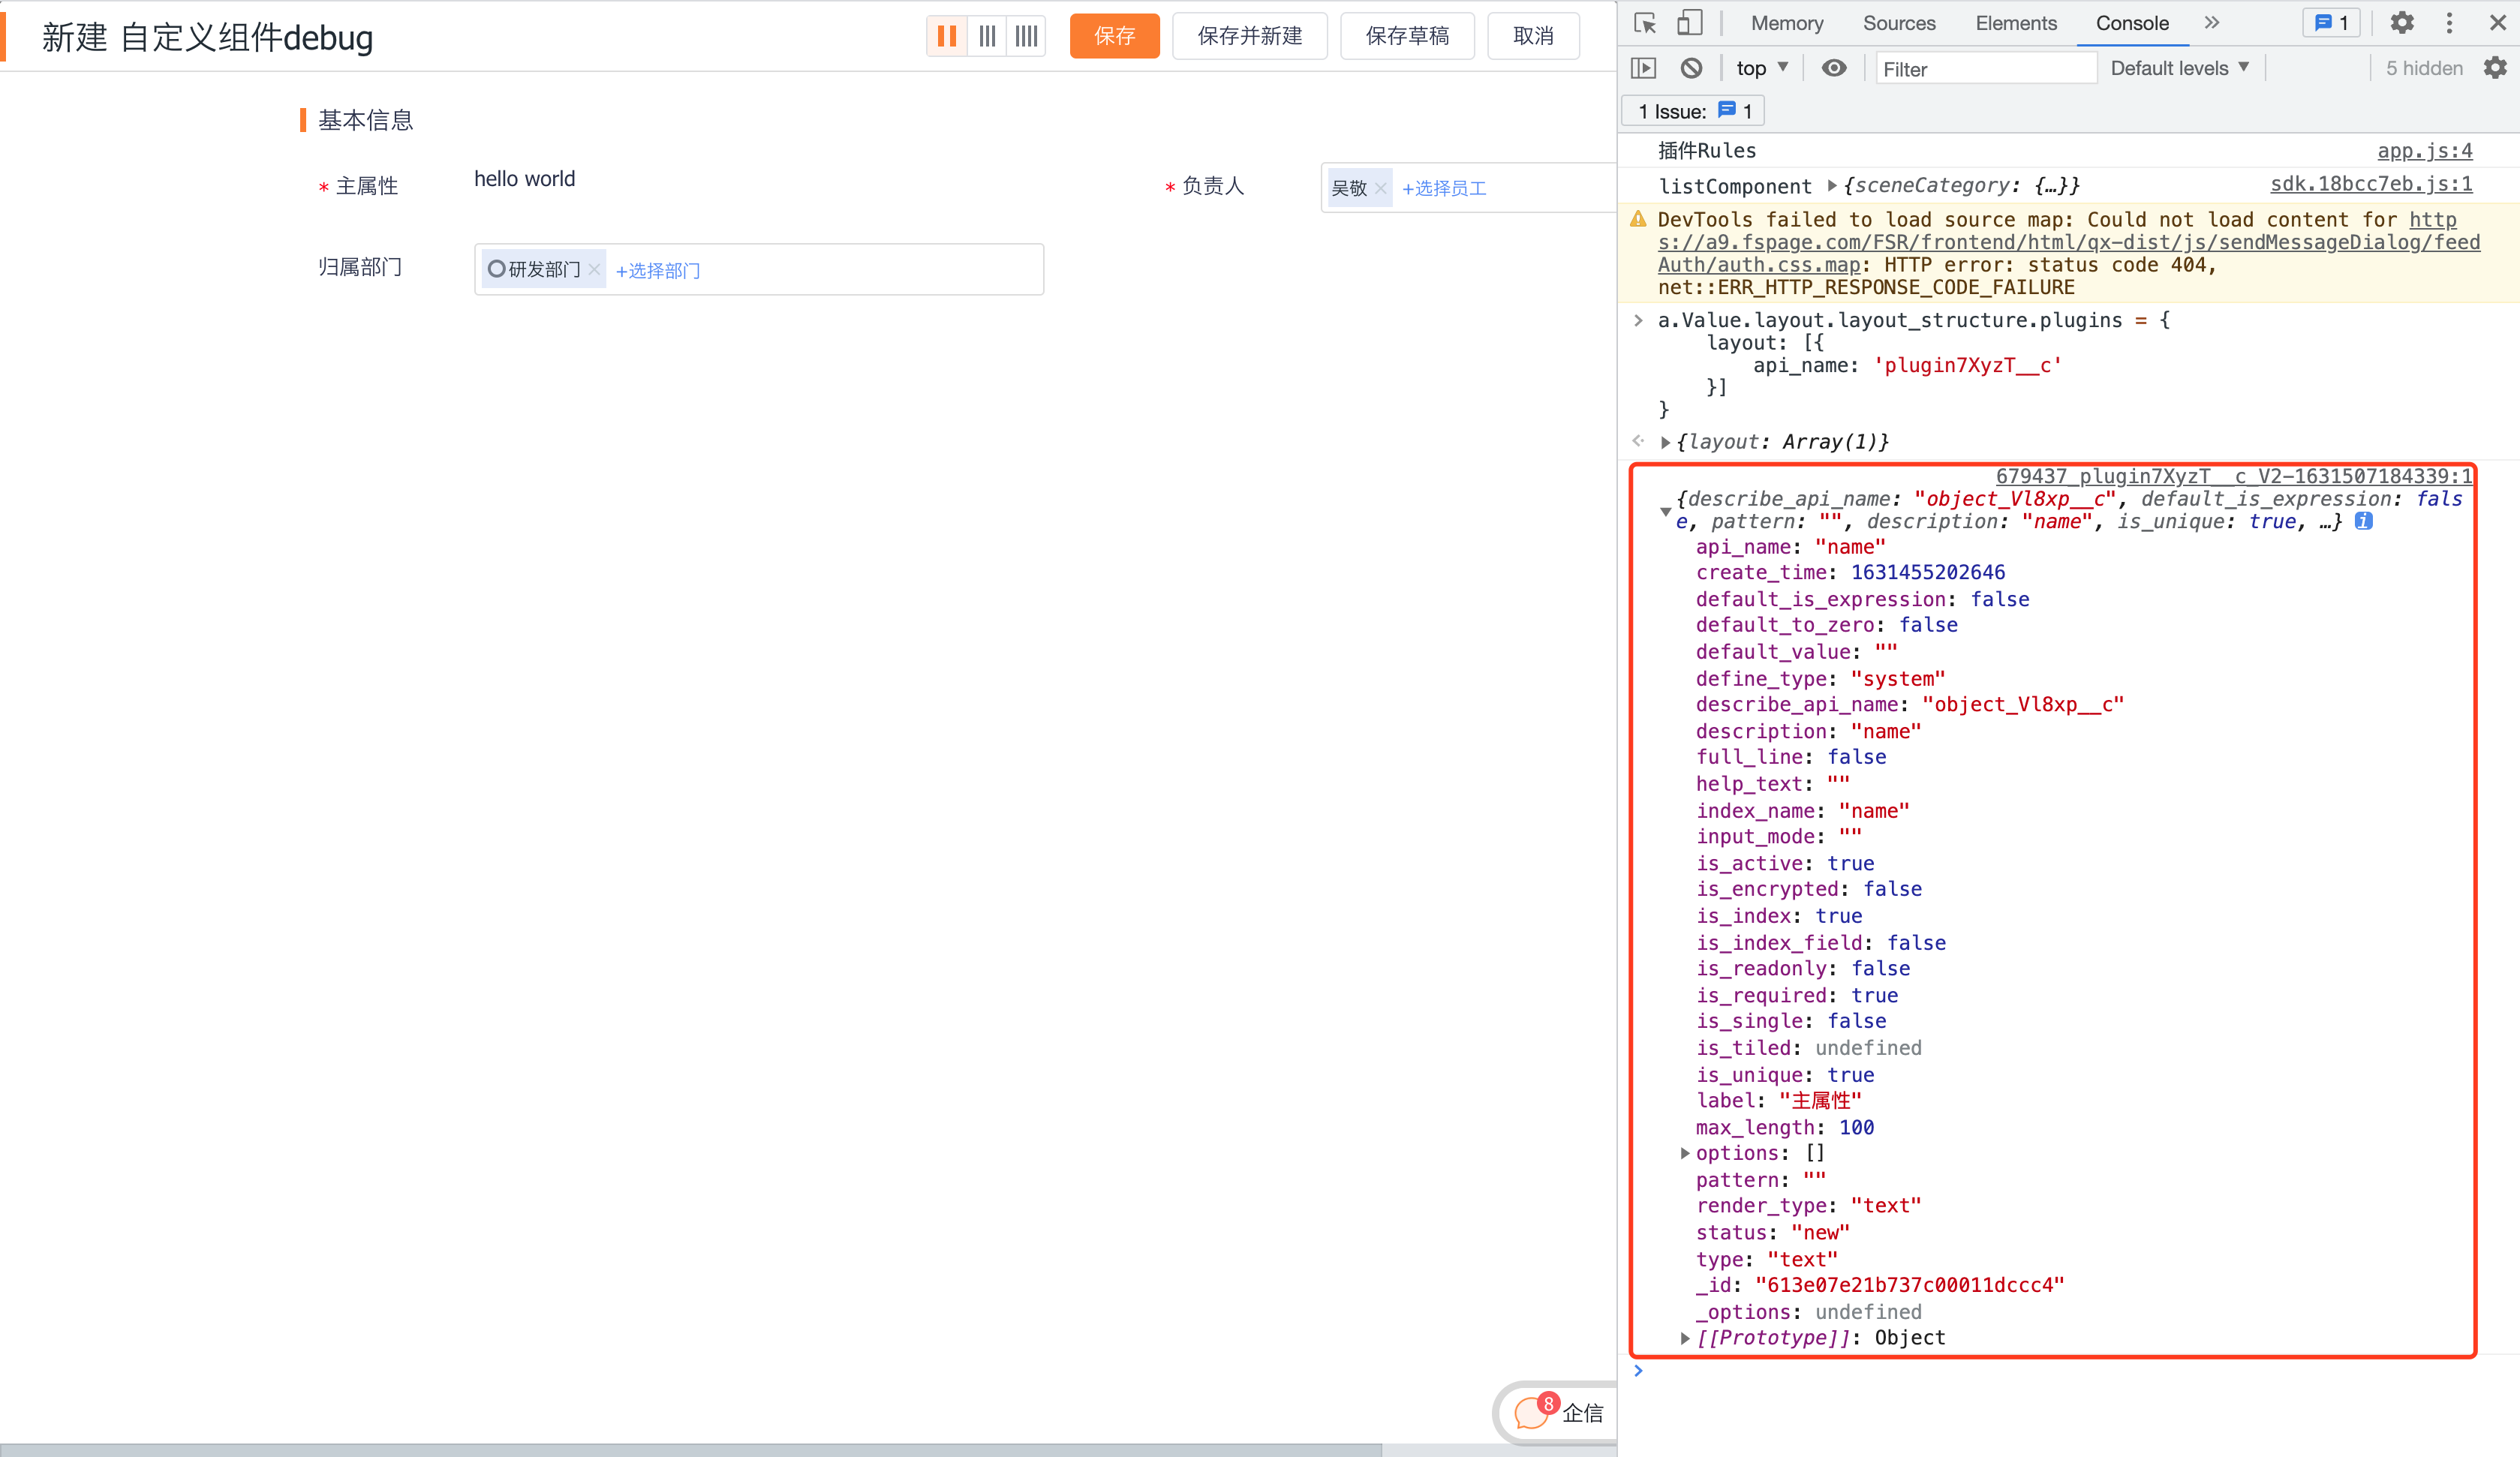
# Output key data through console.log.
Add console.log to the source code

View data through the console panel
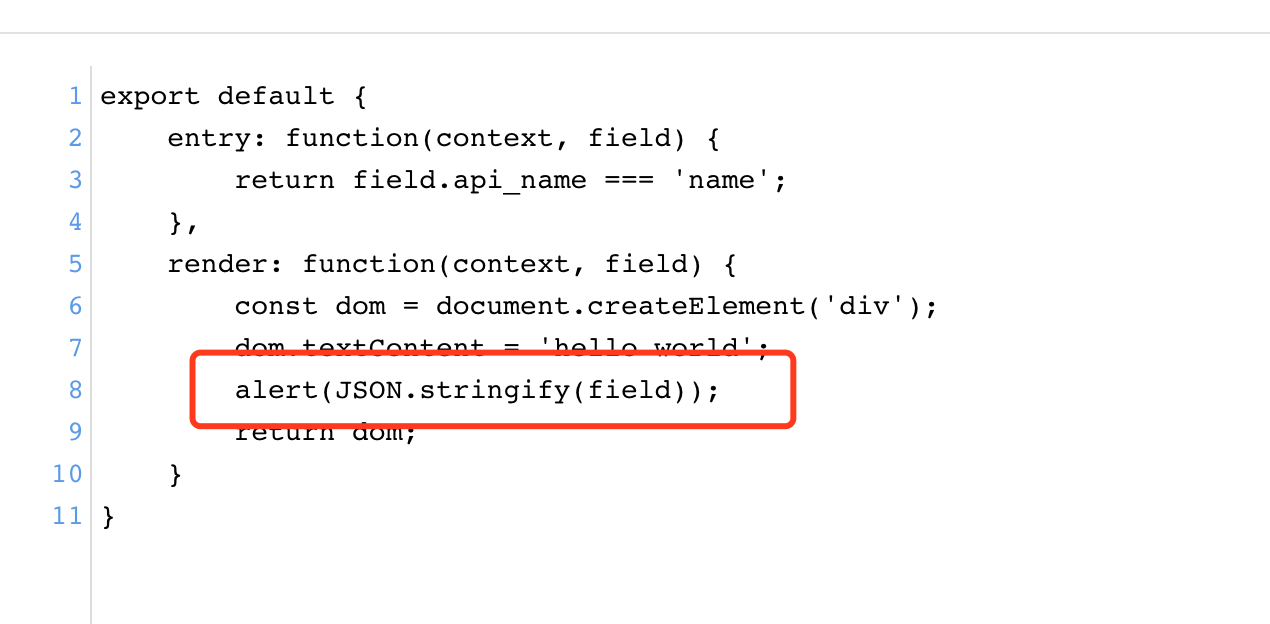
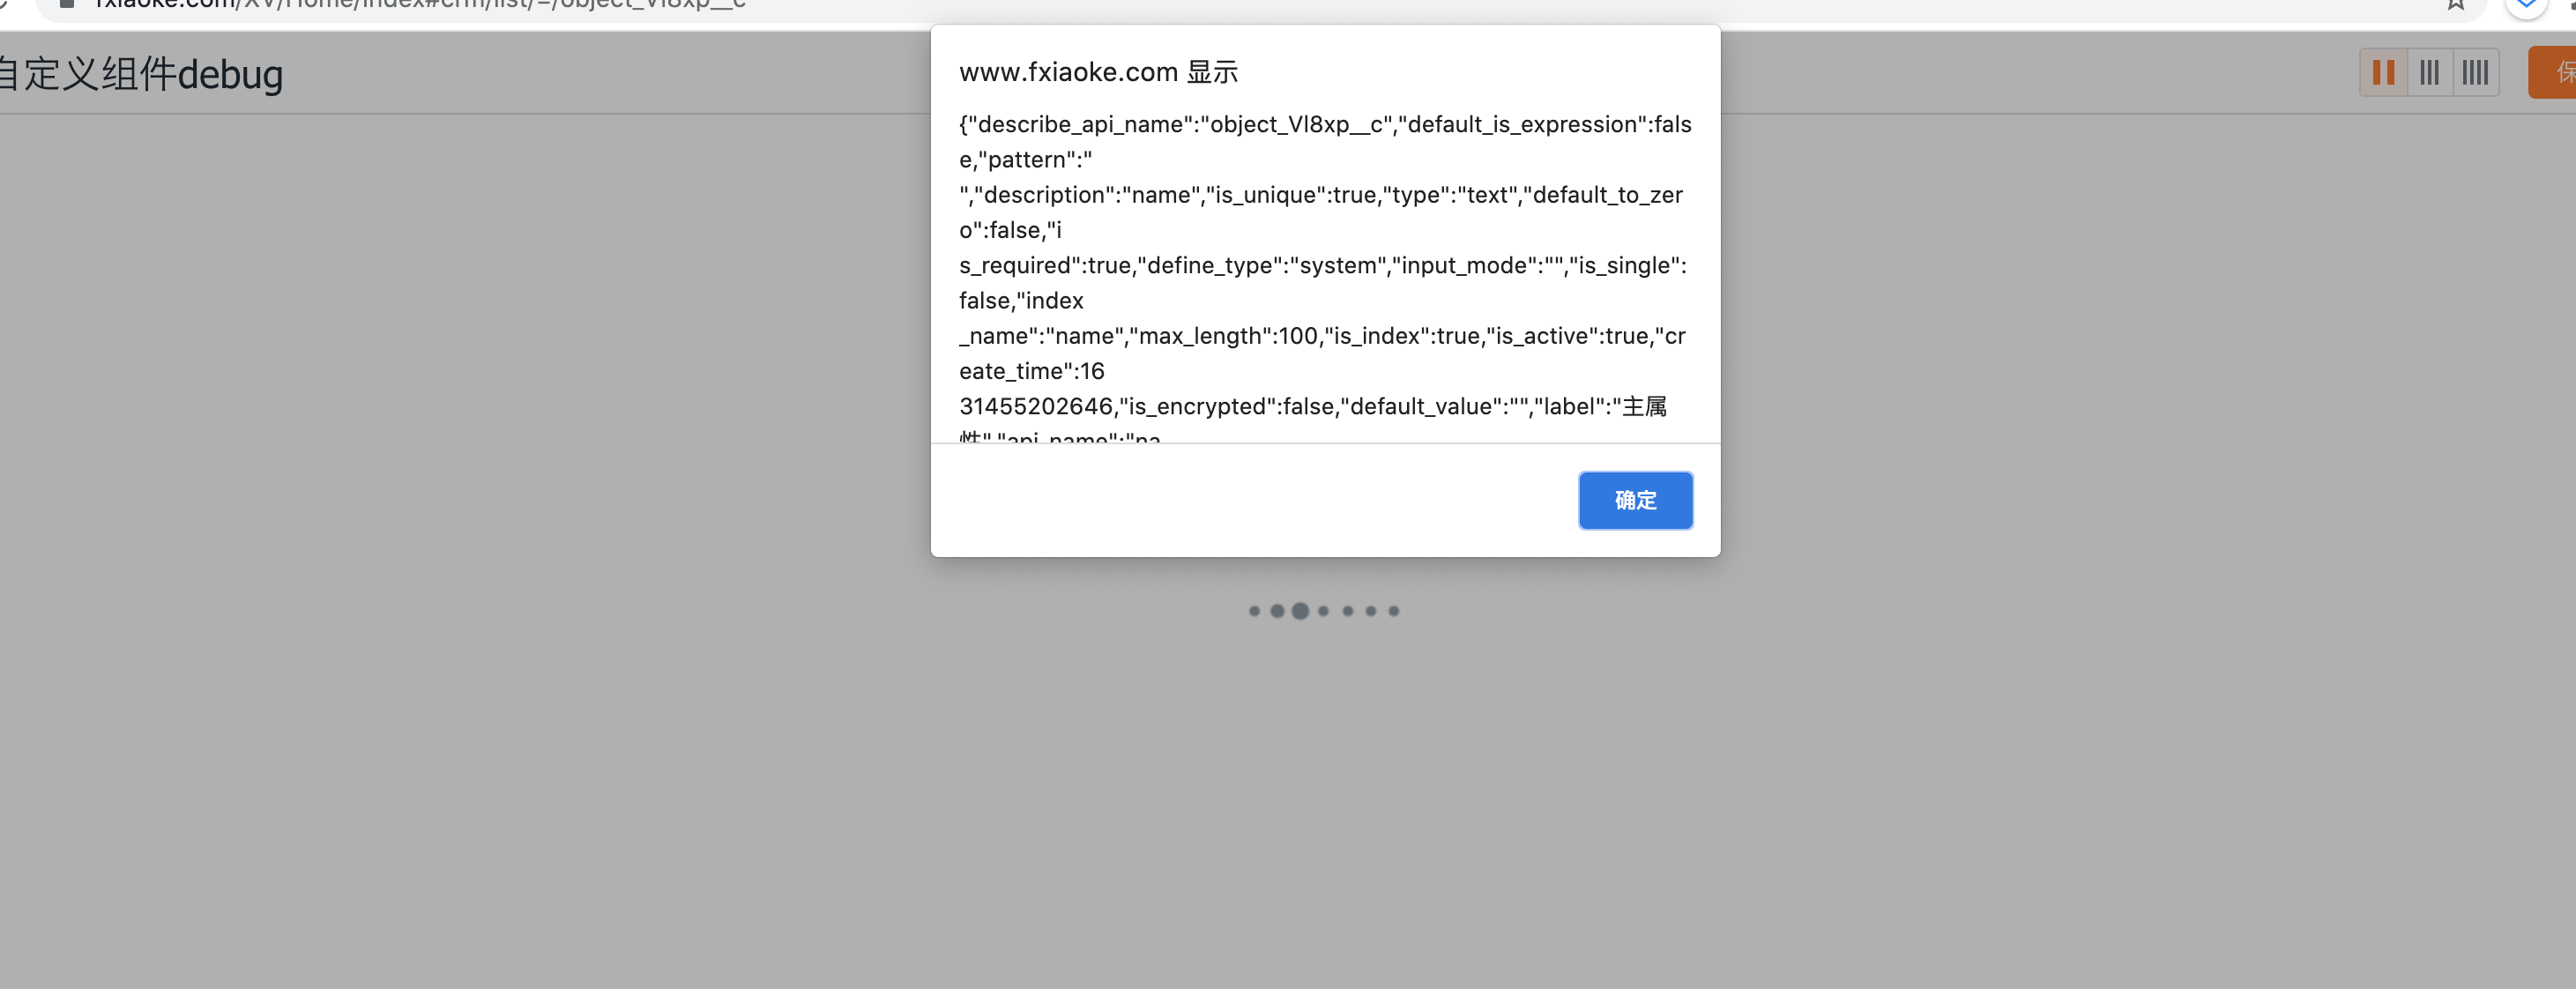
# Output key data through alert.
Add alert to source code
View data in view
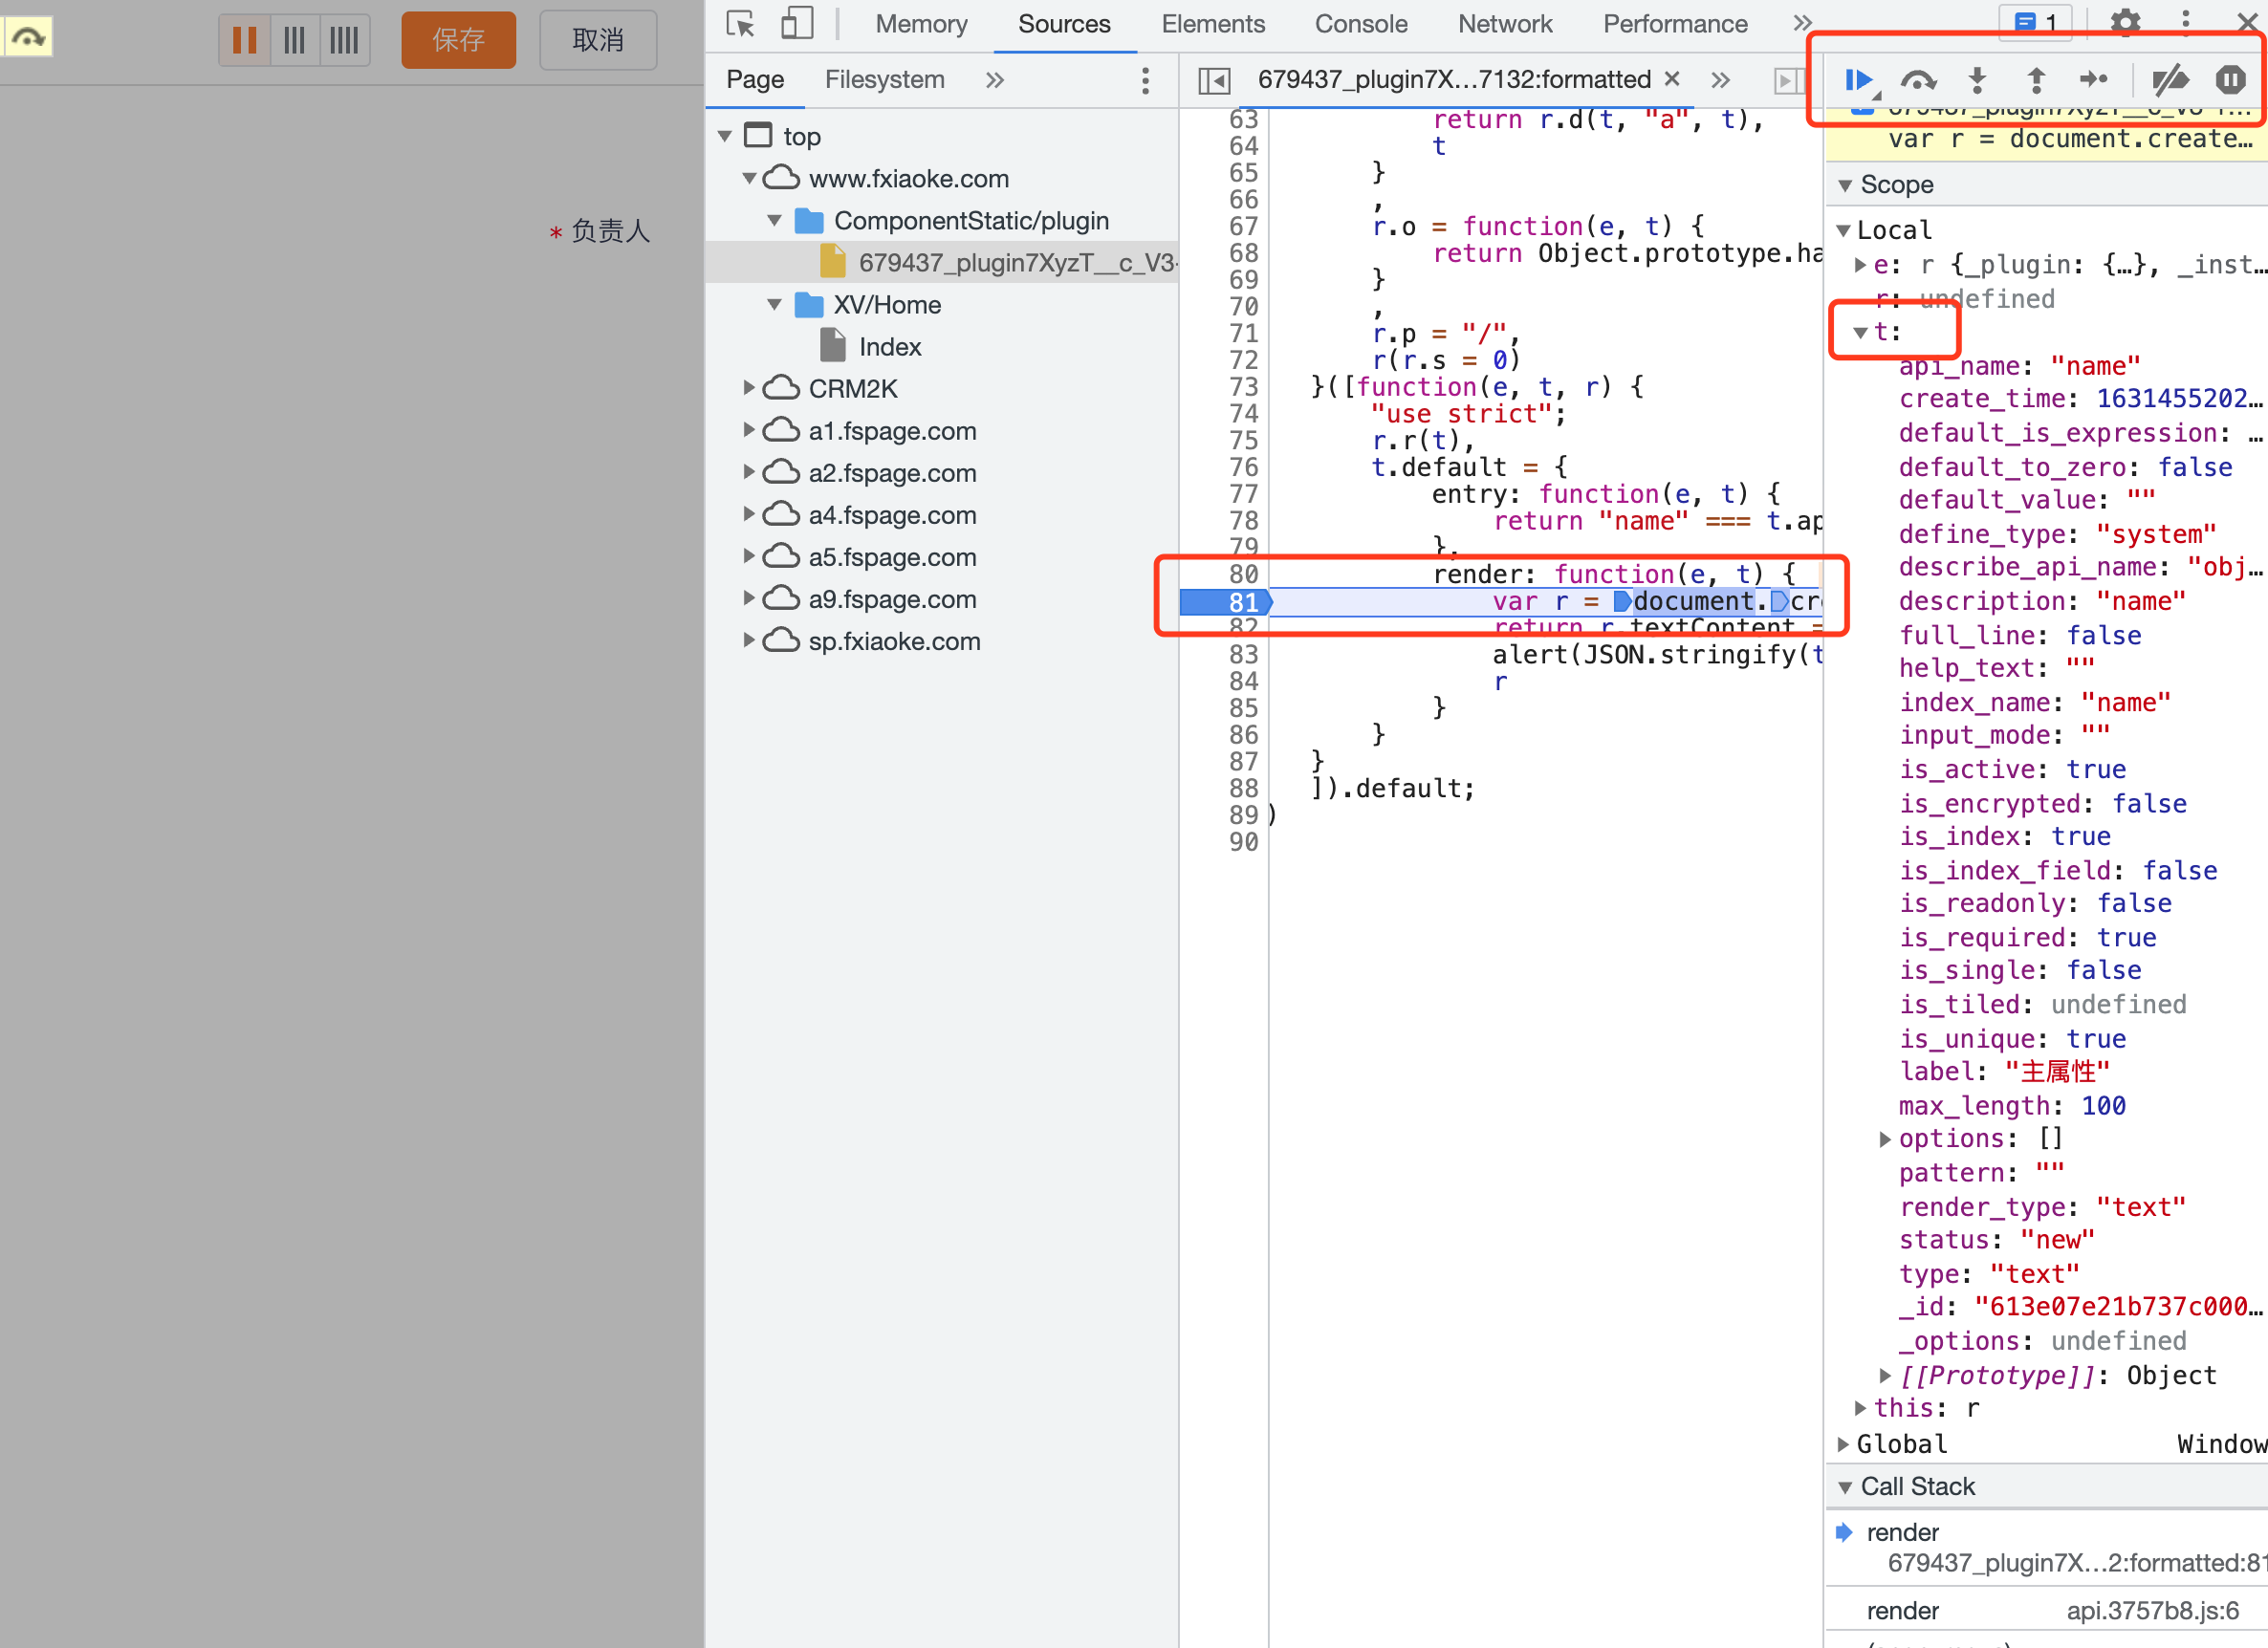
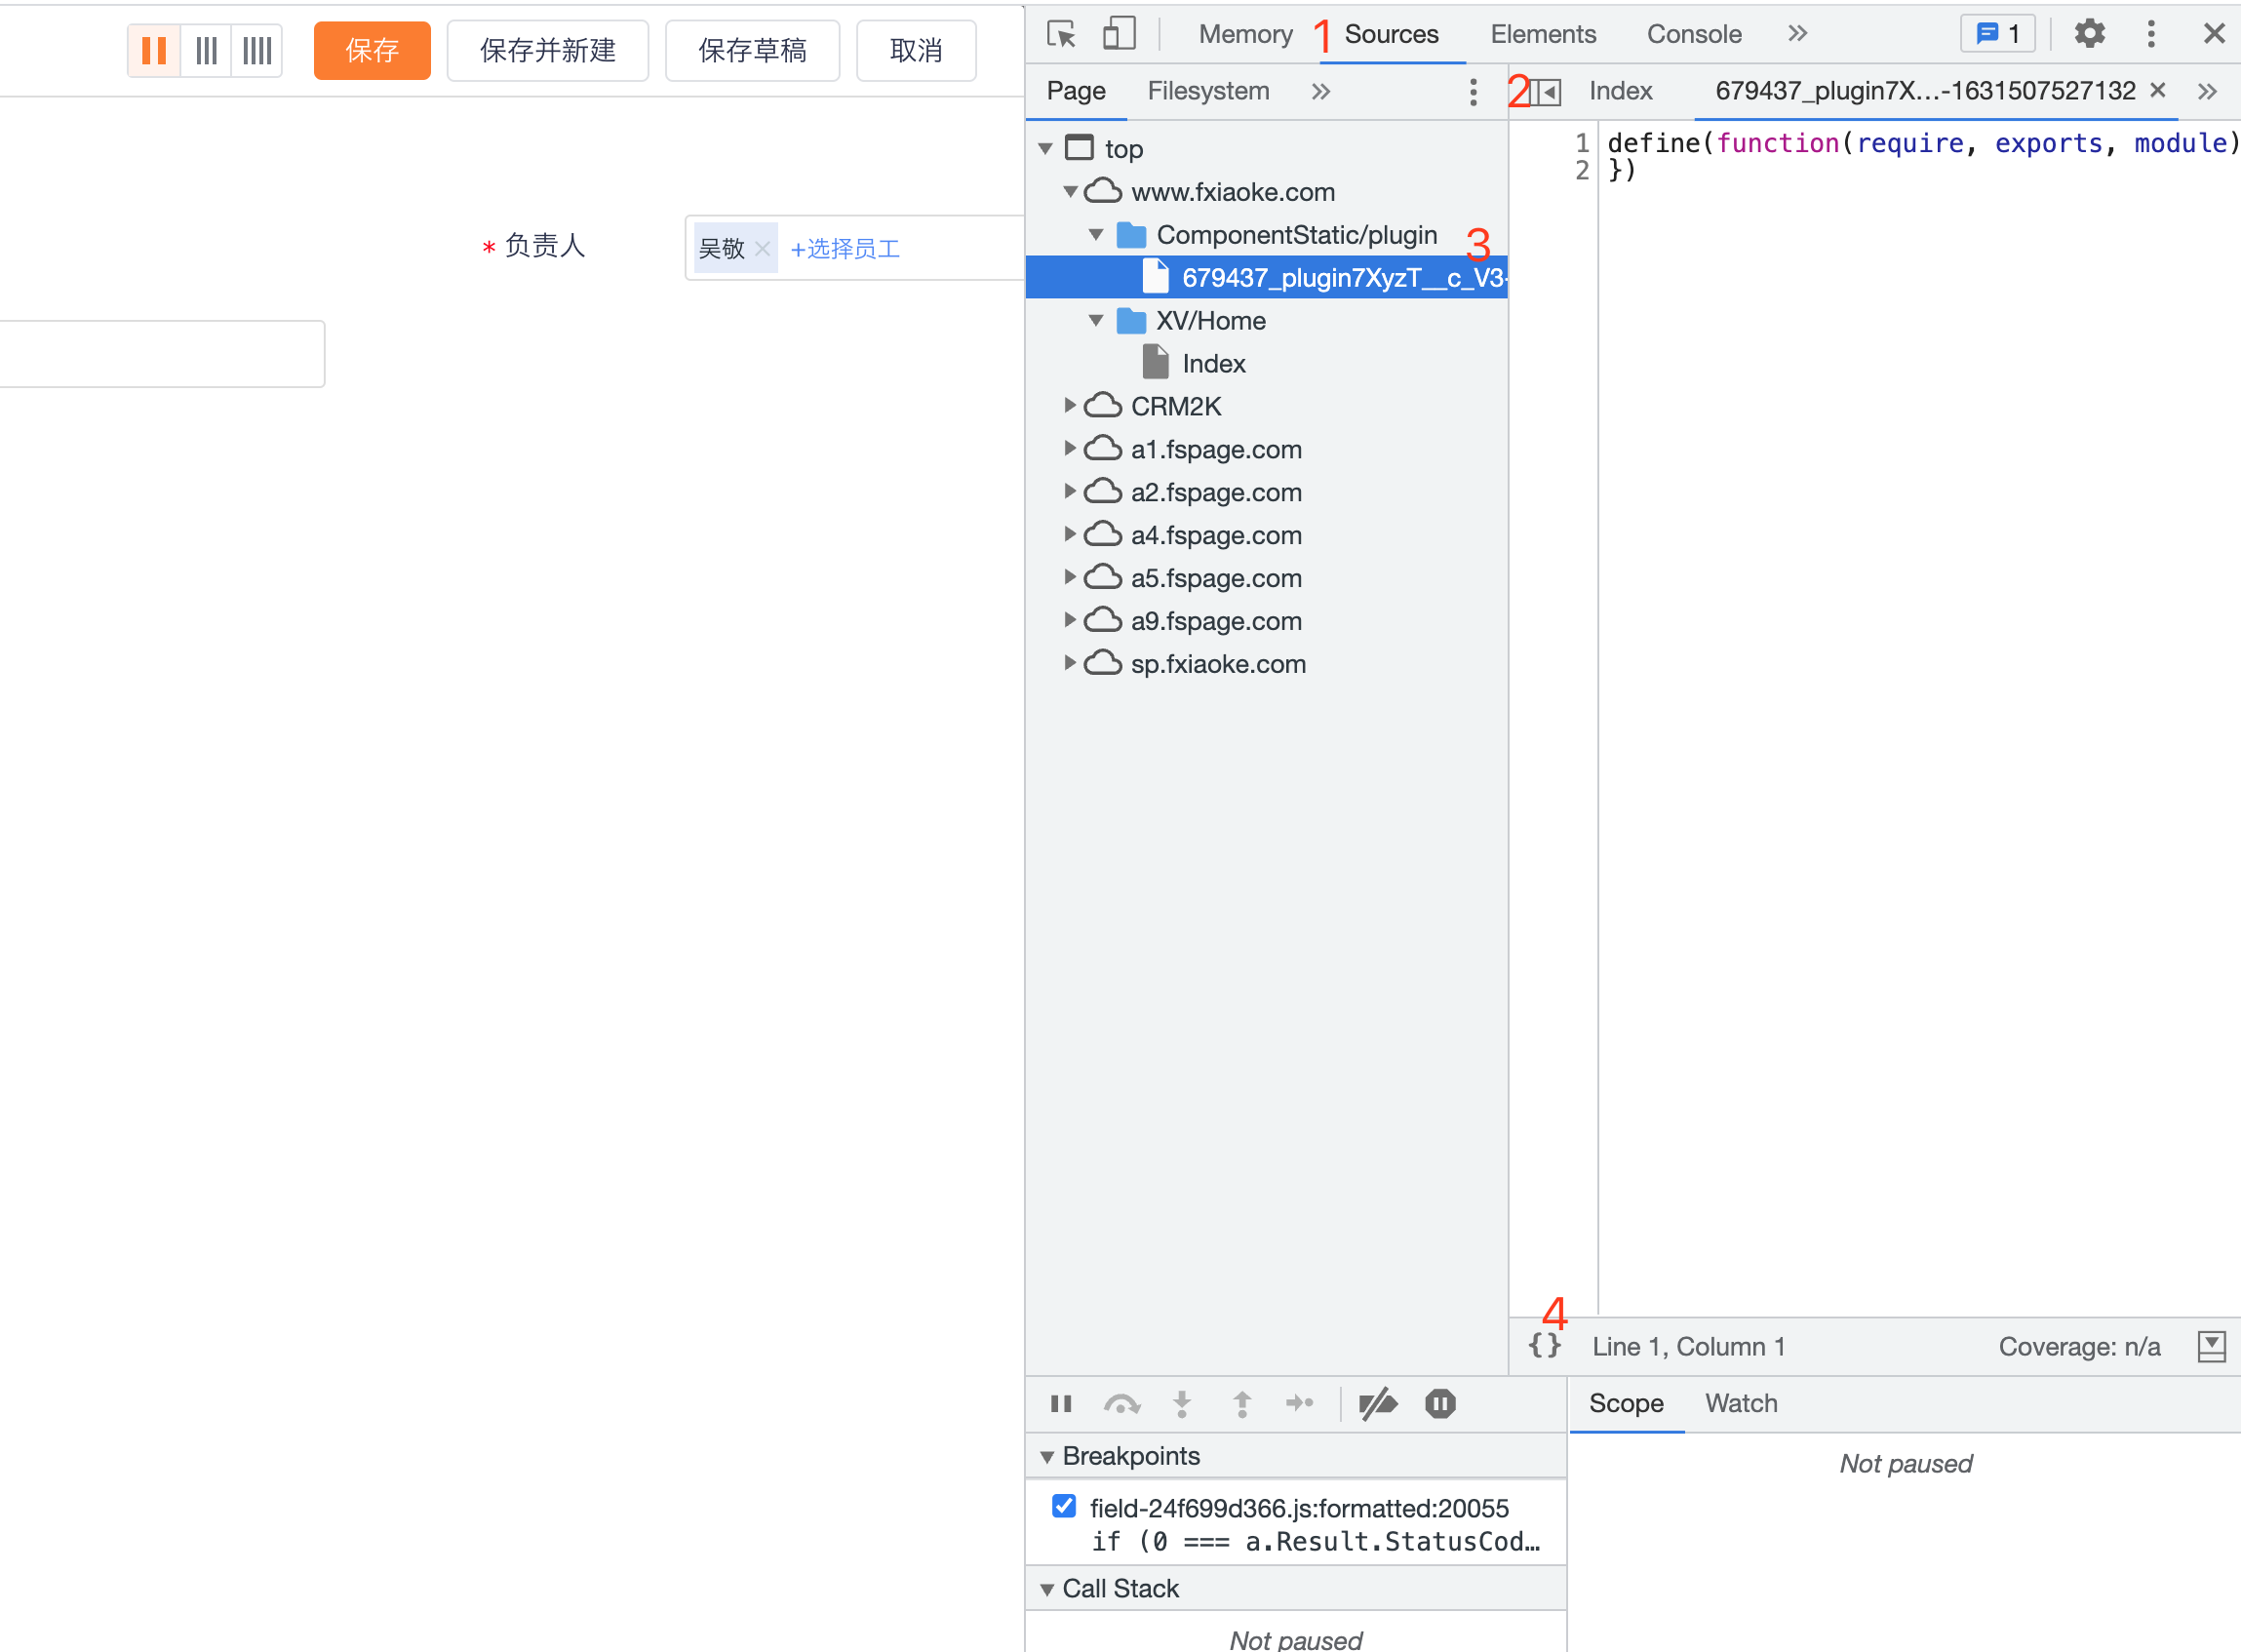
# Debugging through source code
Find the source code through the source panel
Click on the line number to make a breakpoint
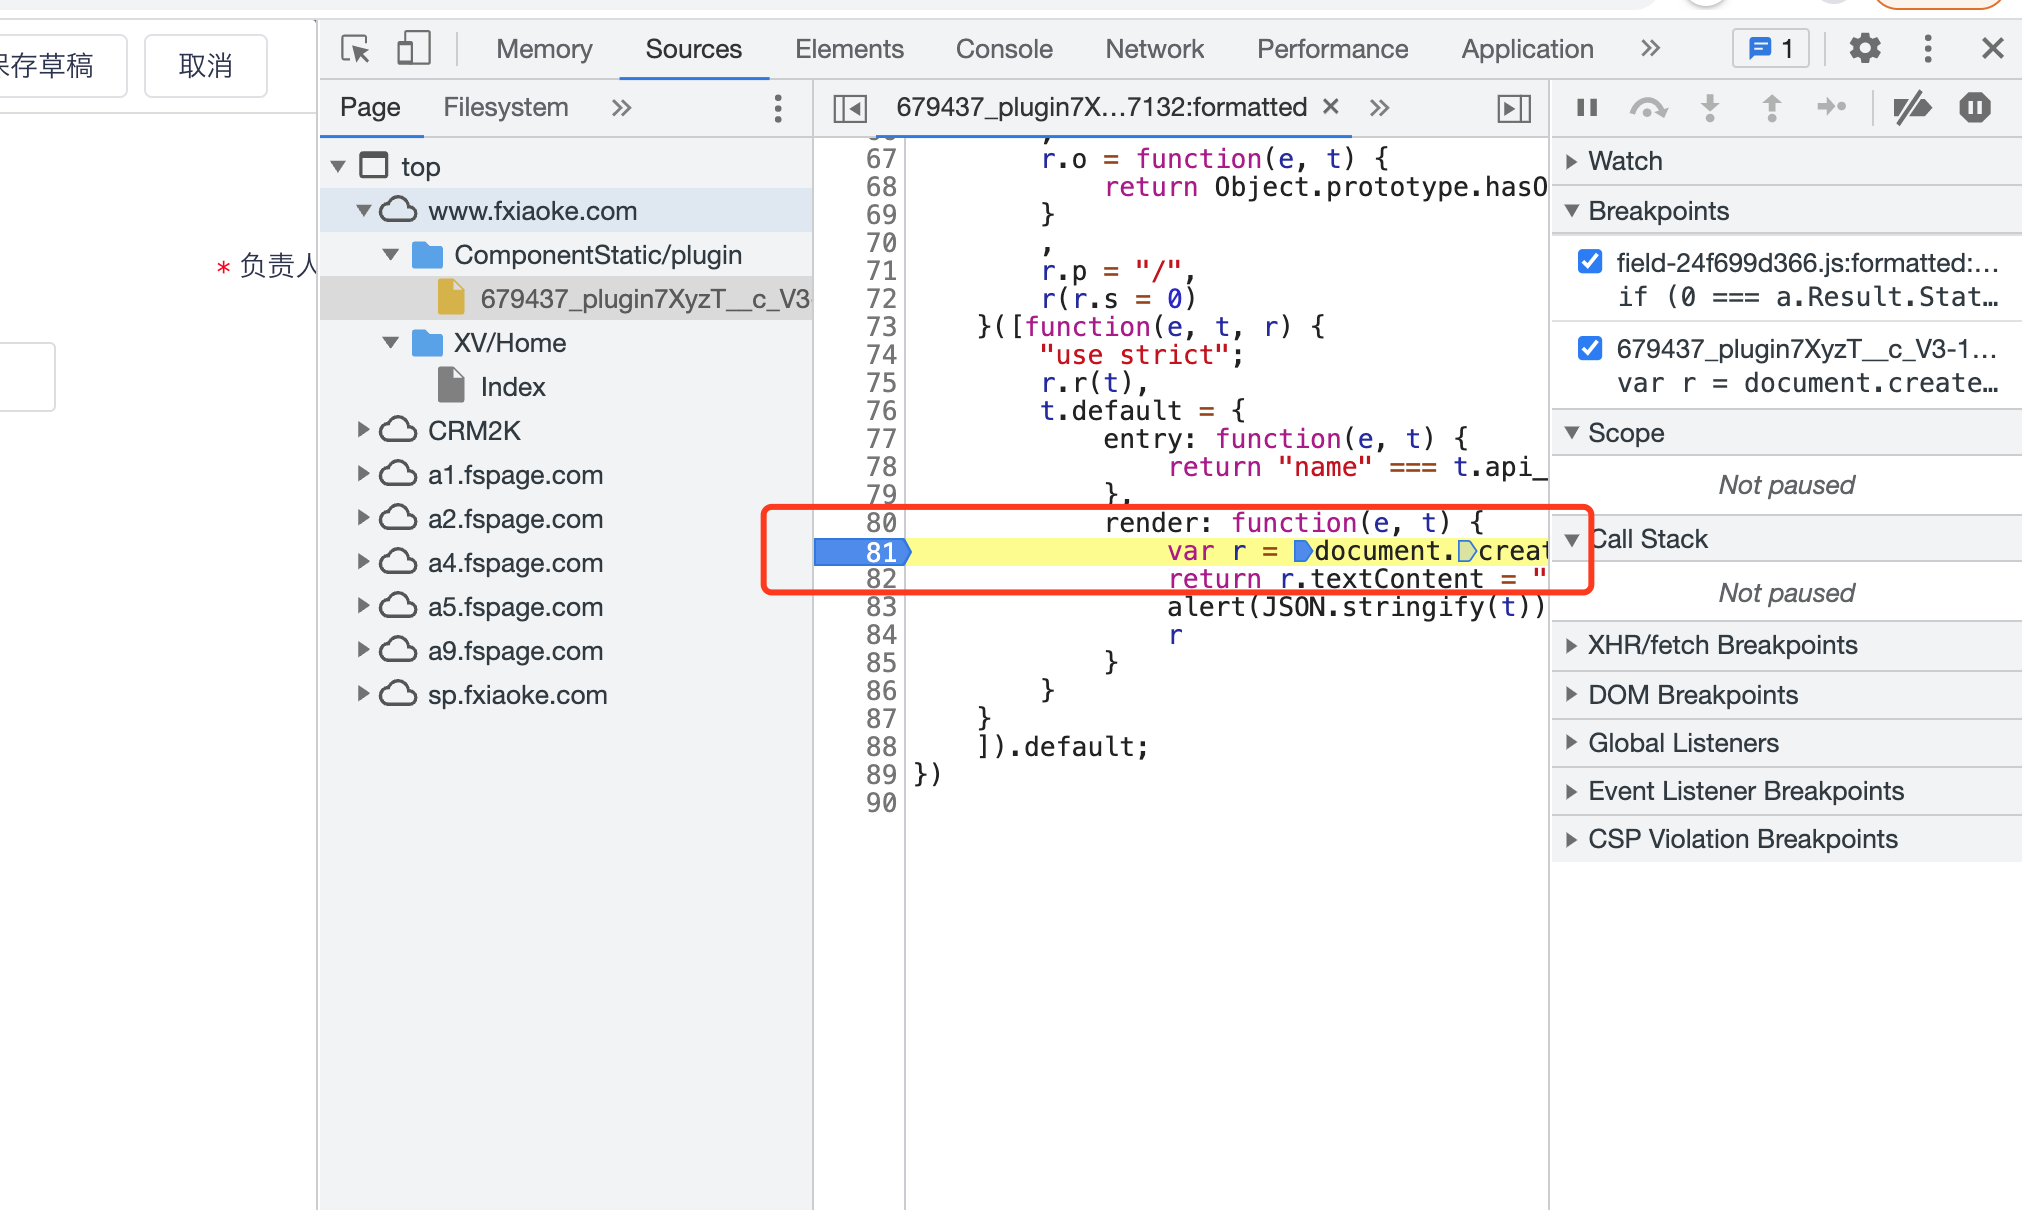
Refresh line details trigger breakpoint